As of 25 July 2026 · Data from AMS and BIBB
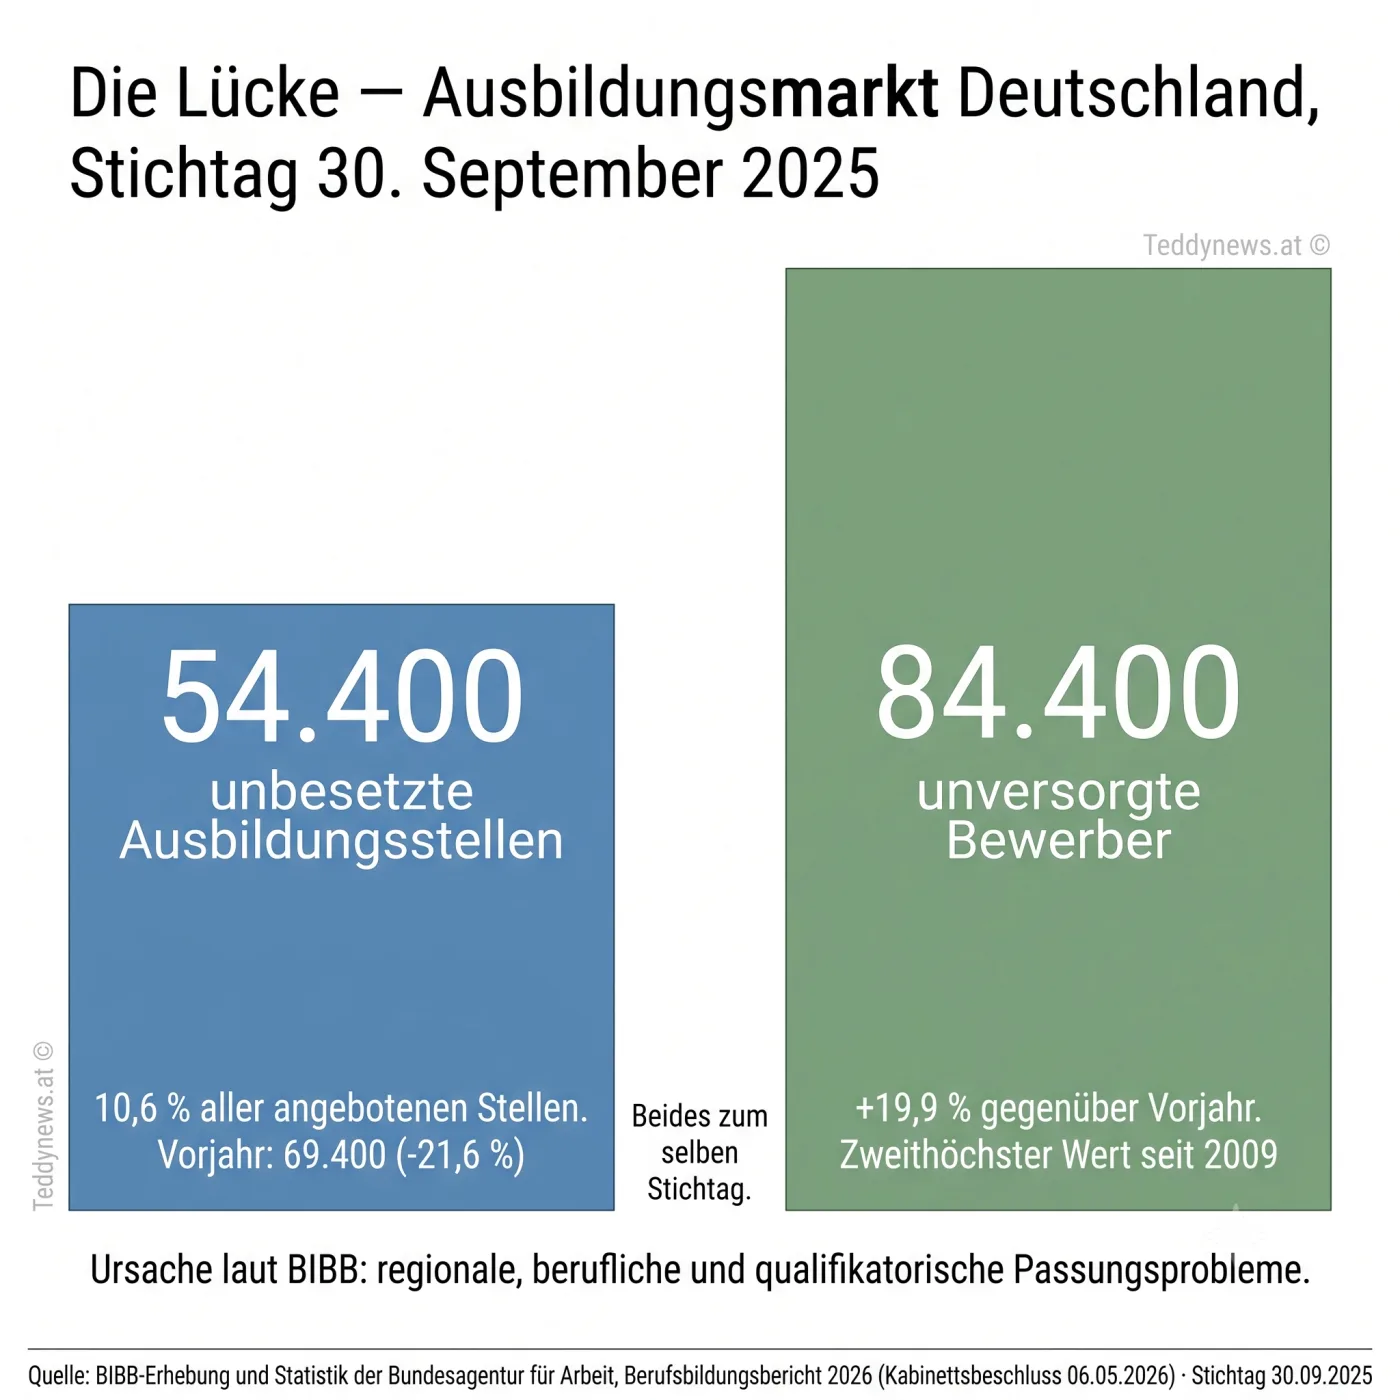
54,400 apprenticeship places stayed empty. 84,400 applicants found none. Both on the same day.
Germany, reporting date 30 September 2025. This is neither a contradiction nor an arithmetic error — it is the finding: supply and demand do not meet. Not by region, not by occupation, not by qualification. The Federal Institute for Vocational Education and Training calls this a matching problem.
This page shows where the gap is. Every figure carries its source, its reporting date and — for any change — its base year. Check us.

The situation
What holds up — and what is routinely framed wrong
Youth unemployment in Austria has risen 25.5 per cent since 2022. That figure is correct and still misleading: 2022 was the lowest value in the entire twelve-year series. Against 2018 the 2024 figure is 1.3 per cent lower; against 2015 it is 31.4 per cent lower. The increase is real. The level is not historically exceptional.
Youth unemployment Austria, annual average ages 15–24 · choose the base year
The same target figure, four base years. This is exactly where the distortion happens — so here it is operable instead of asserted:
25,518 (2022) to 32,037 (2024). 2022 is the lowest value in the whole 2013–2024 series. Choosing this base year maximises the increase. It is also the figure most often quoted. DerivedBase 2022 · as of 2024
32,444 (2018) to 32,037 (2024). Against the pre-Covid year 2018 the level is practically unchanged — slightly below it. DerivedBase 2018 · as of 2024
46,701 (2015) to 32,037 (2024). 2015 was the peak of the series. Choosing that base year turns the same end value into a steep decline. DerivedBase 2015 · as of 2024
Twelve-year mean 36,565 against 32,037 in 2024. 2024 is the fifth lowest of twelve years. This is the classification without a base-year choice — and the only one that carries no framing with it. DerivedMean 2013–2024
Every base year in the series, so you can recalculate it yourself
| Base year | Value | Change to 2024 (32,037) |
|---|---|---|
| 2015 | 46,701 | −31.4 % |
| 2016 | 44,158 | −27.4 % |
| 2013 | 42,744 | −25.0 % |
| 2017 | 37,756 | −15.1 % |
| 2018 | 32,444 | −1.3 % |
| 2019 | 30,270 | +5.8 % |
| 2021 | 30,226 | +6.0 % |
| 2022 | 25,518 | +25.5 % |
Source: AMS Austria Measured for the annual values, changes Derived. This table is here because a single change figure without its base year cannot be verified.
What holds up
- Under-25s in Austria, June 2024 to June 2025: +11.2 % Measured
- Unemployment rate for under-25s in Vienna, July 2025: 11.7 % Measured
- Most affected according to AMS Vienna: technical occupations, programmers, laboratory technicians Measured
- Applicants left without a place in Germany at their second-highest level since 2009 Measured
- Young people affected by joblessness in Austria: 57,420 (2022) to 73,054 (2024) Measured
Exposure is concentrated by occupation, not spread across the board. That difference decides what the useful next step is.
What points the other way: it is currently improving
- Vienna, November 2025: under-25s −0.2 % — the first decline since August 2022 Measured
- AMS assessment mid-2026, verbatim: “The slight decline in youth unemployment is positive … so it is slowly getting better” Measured
- Job vacancies in Carinthia, April 2026: +17.7 %, growth in technical trades, auxiliary work and construction Measured
- Youth unemployment rate Upper Austria 2025: 5.6 % Measured
- School-based vocational training in health, education and social care in Germany: entrants +3.8 % Measured
Both columns are here because a page with only one of them could not be verified. Overall unemployment rate Austria April 2026: 7.5 per cent against 7.3 per cent in April 2025 Measured.
The gap
Two figures from the same reporting date
A matching problem is not a shortage: there are enough places, they are simply in other locations, other occupations or carry other requirements than the applicants. The Federal Institute for Vocational Education and Training names three causes explicitly — regional, occupational and qualification-related. The practical difference: a shortage has no address, a matching problem has one.
Germany, reporting date 30 September 2025
10.6 % of all places offered
2024: 69,400 · −21.6 %
+19.9 % against 2024
second-highest value since 2009
Bar heights are to scale with each other. Source: BIBB survey and Federal Employment Agency statistics, published in the Vocational Training Report 2026 (cabinet decision 6 May 2026) MeasuredReporting date 30.09.2025 · base 2024
Arithmetically that puts 1.55 applicants without a place on every vacant position Derived. This is not a balance: the places are elsewhere and in other occupations.
Austria, September 2025 — same structure, opposite sign
immediately available
−17.9 % against 2024
without an offer in hand
+11.0 % against 2024
AMS Austria, special report on the apprenticeship market 09/2025 MeasuredAs of 09/2025 · base 09/2024
The sign has flipped: from 2021 to 2024 Austria had a clear surplus of vacant apprenticeships; in 2024 the market was nearly balanced (a surplus of around 200 places). In the 2025 annual average there are around 2,190 too many seekers for the first time. Forecast for 2026: a gap of 3,720 with around 9,900 seekers Forecast.
Apprenticeship pressure: seekers per vacant place
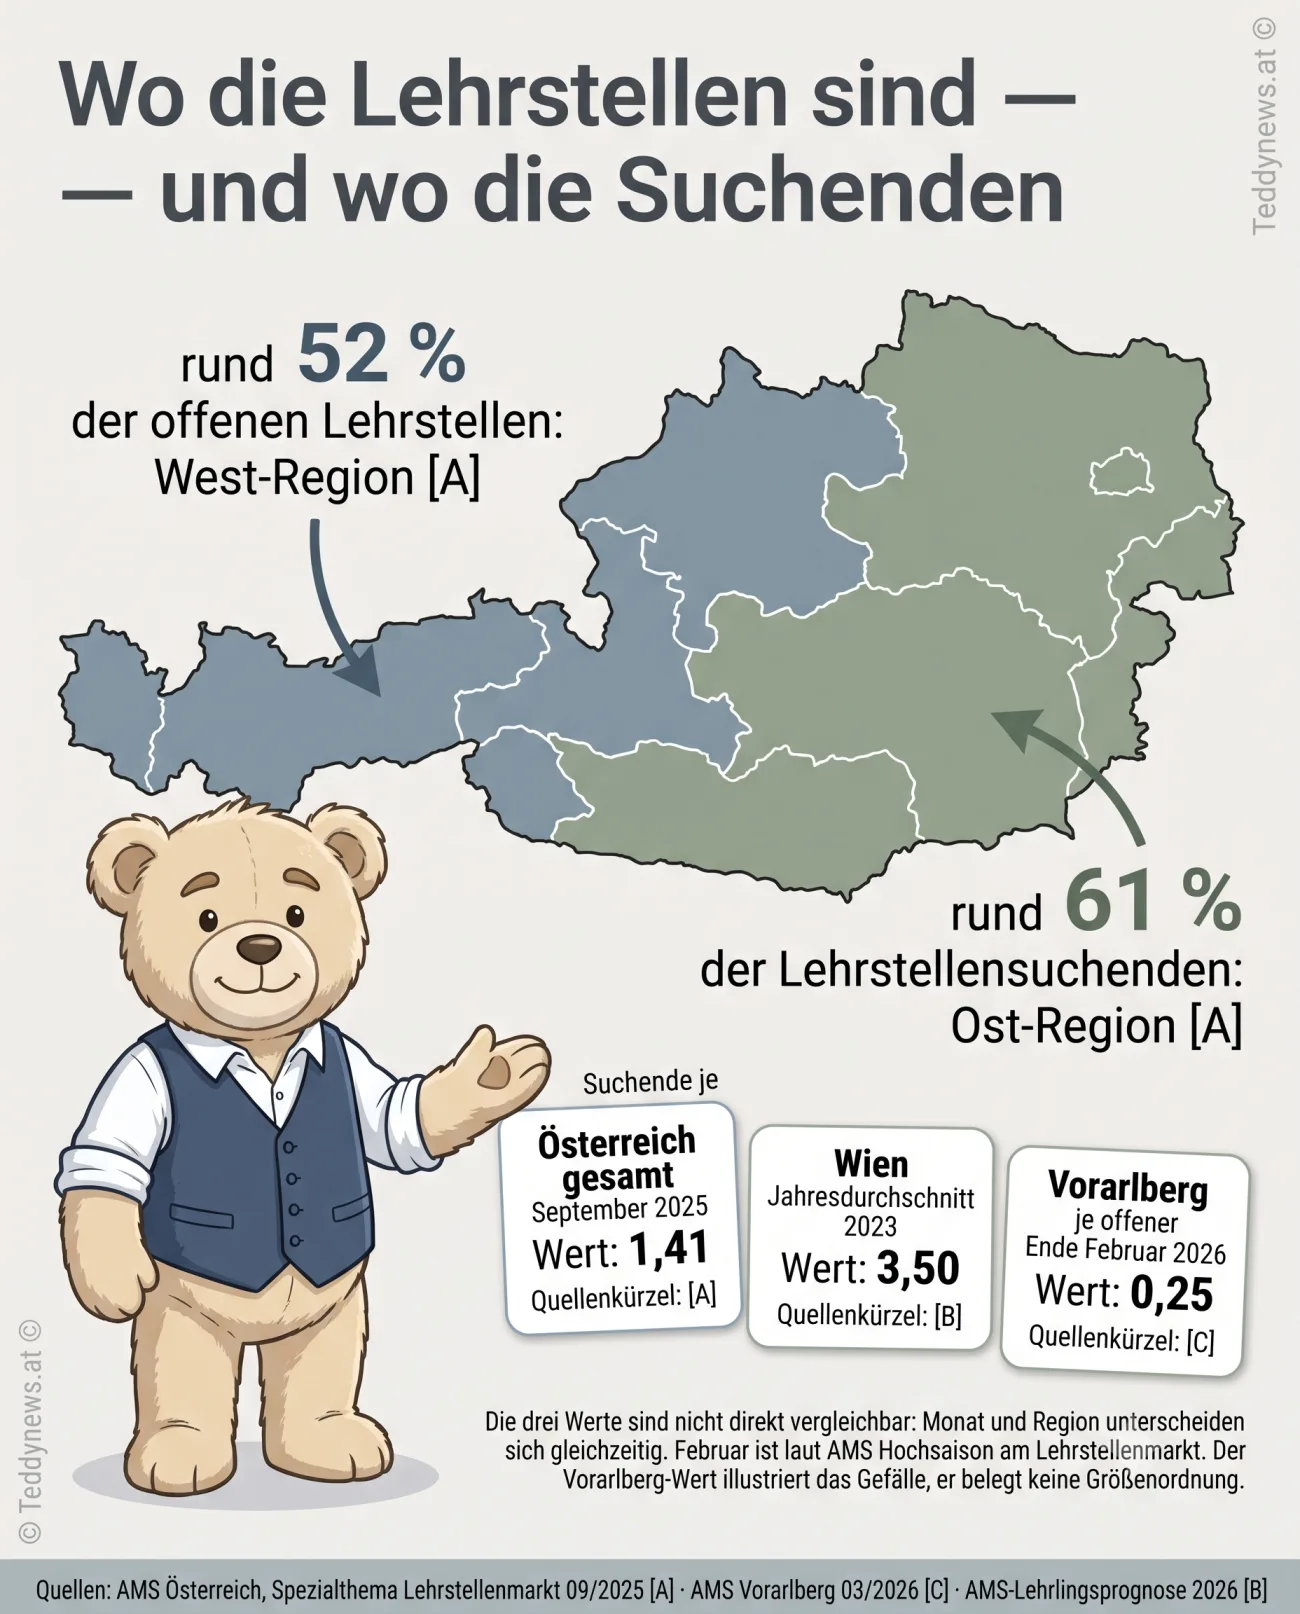
Above 1.0 means more seekers than places. In 2023 Vienna was the only federal province above 1.0 Measured.
The Vorarlberg value is deliberately drawn as an outline: it is Uncertain — it differs from the national September value in month and region at the same time, and AMS explicitly calls February the high season on the apprenticeship market. The distance is a factor of 5.6 and cannot be split into a seasonal and a regional share from this data. Usable as an illustration of the west-east divide, not as evidence of magnitude.
Gap map
Pick the region — and see what the ratio looks like there
Apprenticeship pressure is the number of people seeking an apprenticeship per vacant place. Below 1.0 means more places than seekers. Above 1.0 means more seekers than places. The German supply-demand ratio used by BIBB counts the other way round, namely places per 100 people demanding one. Both measure the same relationship from opposite directions.
Six regions for which documented values exist. Where no value exists, that is what it says:
10,823 seekers without an offer in hand, 7,678 immediately available places. Arithmetic surplus: 3,145 people. In the 2025 annual average around 2,190 — in 2024 the market was nearly balanced. Derived from Measured values
What that means in practice: the national average hides the divide. Switch to Vienna and Vorarlberg — same data, two provinces.
AMS Austria, special report on the apprenticeship market 09/2025 · next survey monthly
For every 100 vacant apprenticeships there were 350 seekers. Vienna was the only federal province above 1.0. The unemployment rate for under-25s stood at 11.7 per cent in July 2025; AMS Vienna names technical occupations, programmers and laboratory technicians as particularly affected. Measured
What that means in practice: in Vienna, searching alone achieves little. The leverage sits in the choice of occupation and in the willingness to look past the city boundary — not in more applications for the same four trades.
AMS FokusInfo 298 · wien.ORF.at 07.07.2025 · the value is an annual average for 2023, not the current month
1,133 reported vacant apprenticeships, 283 registered seekers without an offer in hand. Four vacant places for every person seeking one. Seekers against the same month a year earlier: −4.4 per cent. Uncertain
Why this says “uncertain”: this value is not directly comparable with the national September figure. Month and region differ at the same time, and AMS calls February the high season on the apprenticeship market. The distance is a factor of 5.6 and cannot be split into season and region. Usable as evidence of the divide, not of the magnitude.
AMS Vorarlberg 03/2026 · more than 130 apprenticeship trades available, including application development and coding
For the western region as a whole no separate pressure value exists in the sources used here — so none is given. What is documented is the share of vacant places. Measured
The ibw institute describes the situation as follows: many vacant places in Upper Austria, Salzburg, Styria and Tyrol; many seekers in Vienna. Unmet demand for skilled workers across Austria remains high.
AMS Austria 09/2025 · ibw, apprenticeship training overview 2025 · gap named instead of estimated
For the eastern region as a whole no separate pressure value exists either. What is documented is the share of seekers. Measured
The two figures together are the finding: 52 per cent of the places in the west, 61 per cent of the seekers in the east. That is not an opinion about mobility, it is a description of the distribution.
AMS Austria 09/2025 · gap named instead of estimated
84,400 applicants left without a place, 54,400 vacant positions. Supply 530,300 places (−4.6 per cent), of which 515,300 company-based; 476,000 new contracts (−2.1 per cent) against demand of +0.7 per cent. Derived from Measured values
Broken down by region this sits in BIBB table 37, supply-demand ratio by employment agency district — publicly available. Order of magnitude for 2024 by sector: around 19,000 vacant places in the skilled trades (18 per cent of all company-based trade positions), 42,000 in industry and commerce.
BIBB table overview, table 37 · Vocational Training Report 2026 · next survey annually, in December
The same values as a table — no JavaScript, no selection
| Region | Seekers per place | As of | Status | Source |
|---|---|---|---|---|
| Vienna | 3.50 | annual average 2023 | Measured | AMS FokusInfo 298 |
| Germany | 1.55 | 30.09.2025 | Derived | BIBB / BA |
| Austria | 1.41 | September 2025 | Derived | AMS 09/2025 |
| Austria | 0.70 | annual average 2023 | Measured | AMS FokusInfo 298 |
| Vorarlberg | 0.25 | end of February 2026 | Uncertain | AMS Vorarlberg |
| West region | no value | 2025 | — | only share of vacant places: 52 % |
| East region | no value | 2025 | — | only share of seekers: 61 % |
This table is deliberately open and present in the HTML without any interaction. The selector above is more convenient, but it holds no figure that is missing here.
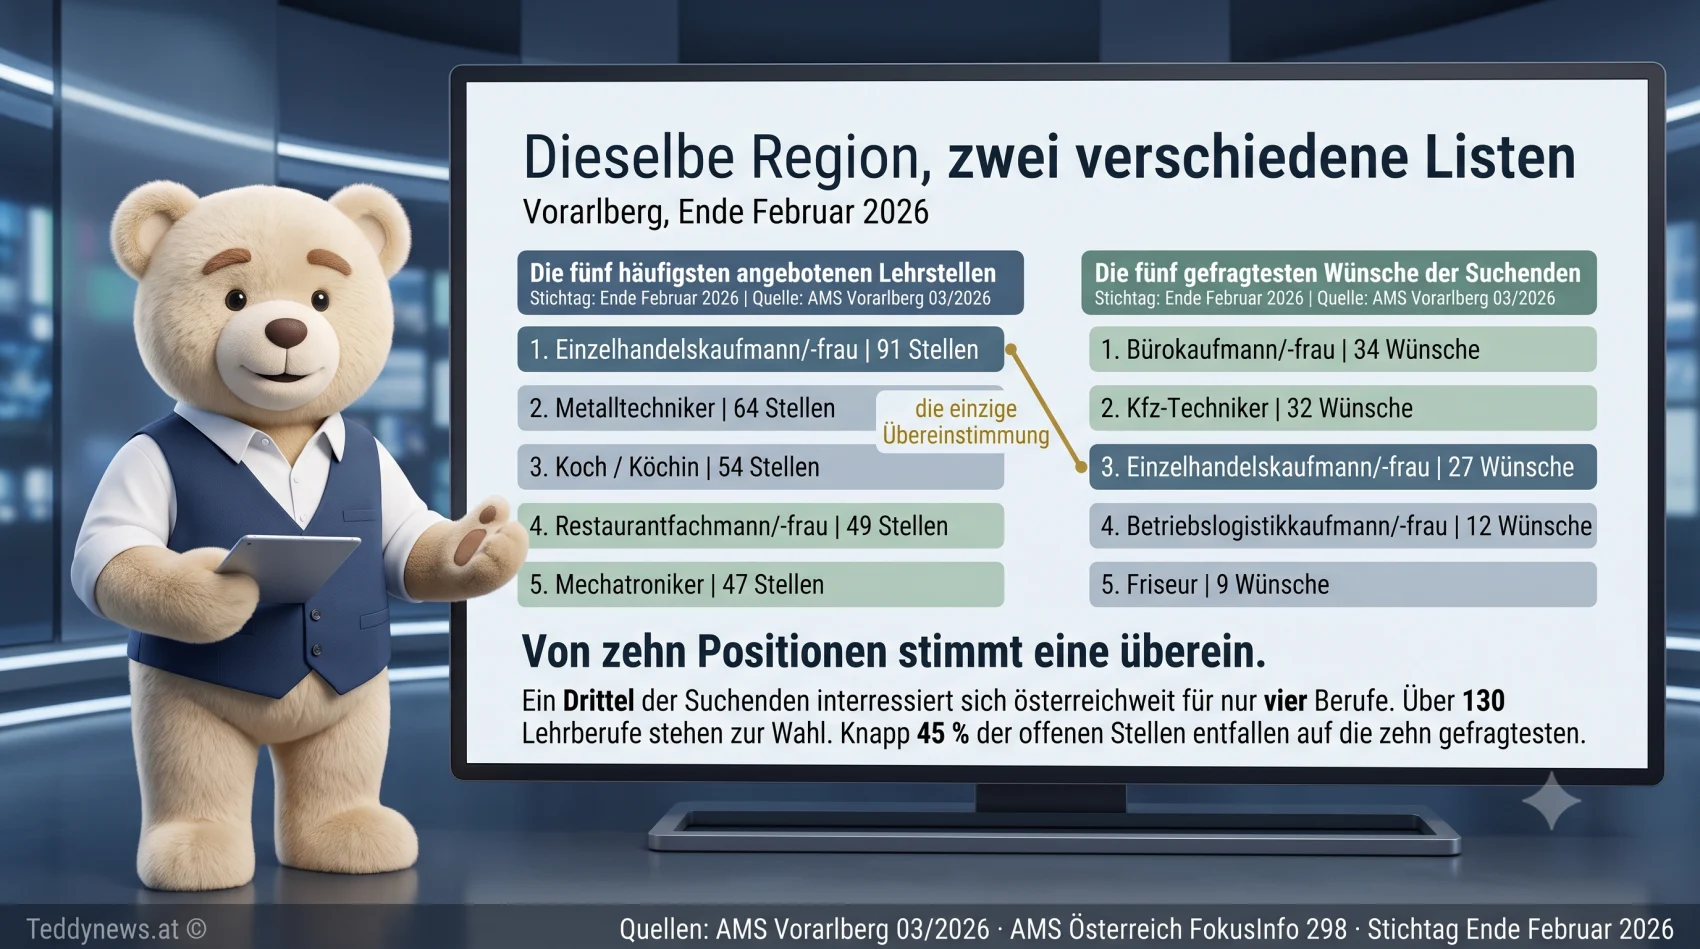
Same region, two different lists — Vorarlberg, end of February 2026
The five most frequently offered apprenticeships
The five most requested by the seekers
Both lists on the same scale, maximum 91. AMS Vorarlberg 03/2026 MeasuredAs of 02/2026
Exactly one occupation appears in both lists: retail sales assistant. The other nine entries are four trades that are offered and not sought, and four that are sought and not offered. That is the matching problem in a single region, on a single reporting date.
What is open
Six places where the vacant positions actually are
All six addresses are public, free and viewable without an account. We opened each of them on 25 July 2026 and checked the status. None of them belongs to Teddynews, and we earn nothing from any of them.
AMS eJob-Room
- Where
- Austria, all provinces
- What
- Vacant apprenticeships and jobs, updated daily
- Effort
- Search possible without an account
- Cost
- none
Federal Employment Agency apprenticeship search
- Where
- Germany, nationwide
- What
- Apprenticeship places, filterable by location and trade
- Effort
- Search possible without an account
- Cost
- none
Skilled trades apprenticeship radar
- Where
- Germany, skilled trade businesses
- What
- Apprenticeships and internships in the trades
- Why here
- In 2024 around 19,000 positions in the trades stayed vacant — 18 per cent of all company-based trade positions
- Cost
- none
Youth coaching (NEBA)
- Where
- Austria, all provinces
- What
- Personal support for school dropout, orientation and the move into training
- For whom
- From the ninth school year to 19; to 25 with a disability or special educational needs
- Cost
- none
AMS advice for job seekers
- Where
- Austria, regional offices
- What
- Advice, courses, apprenticeship placement, supra-company training
- Why here
- The route to the 29,854 training places (2025) runs through this office
- Cost
- none
BIBB table 37
- Where
- Germany, by employment agency district
- What
- Supply-demand ratio per district — the raw data behind this page
- For whom
- Anyone who wants to recalculate rather than believe us
- Cost
- none
Status check on 25 July 2026: all six addresses returned HTTP 200. If one of them is no longer reachable, that is an error on this page — write to us and we correct it and note it under “Data status”.
Understanding money
96 per cent ask for it — the highest single value in the entire survey
In the Ö3 Youth Study 2026, 96 per cent of 16- to 25-year-olds want more everyday knowledge, and financial knowledge is named explicitly. That is the highest value in the whole survey — higher than any figure on work, purpose or leisure. It is a content brief, not a matter of interpretation.
What is missing at school — agreement in per cent
Ö3 Youth Study 2026 MeasuredSurvey 2–29 March 2026
Sampling note, supplied with every one of these figures: this is an open online self-selection survey run by a radio station, not a random sample. The large n (13,457 in the target group) does not replace random selection. Reliable as a ranking and order of magnitude, not as an exact percentage.
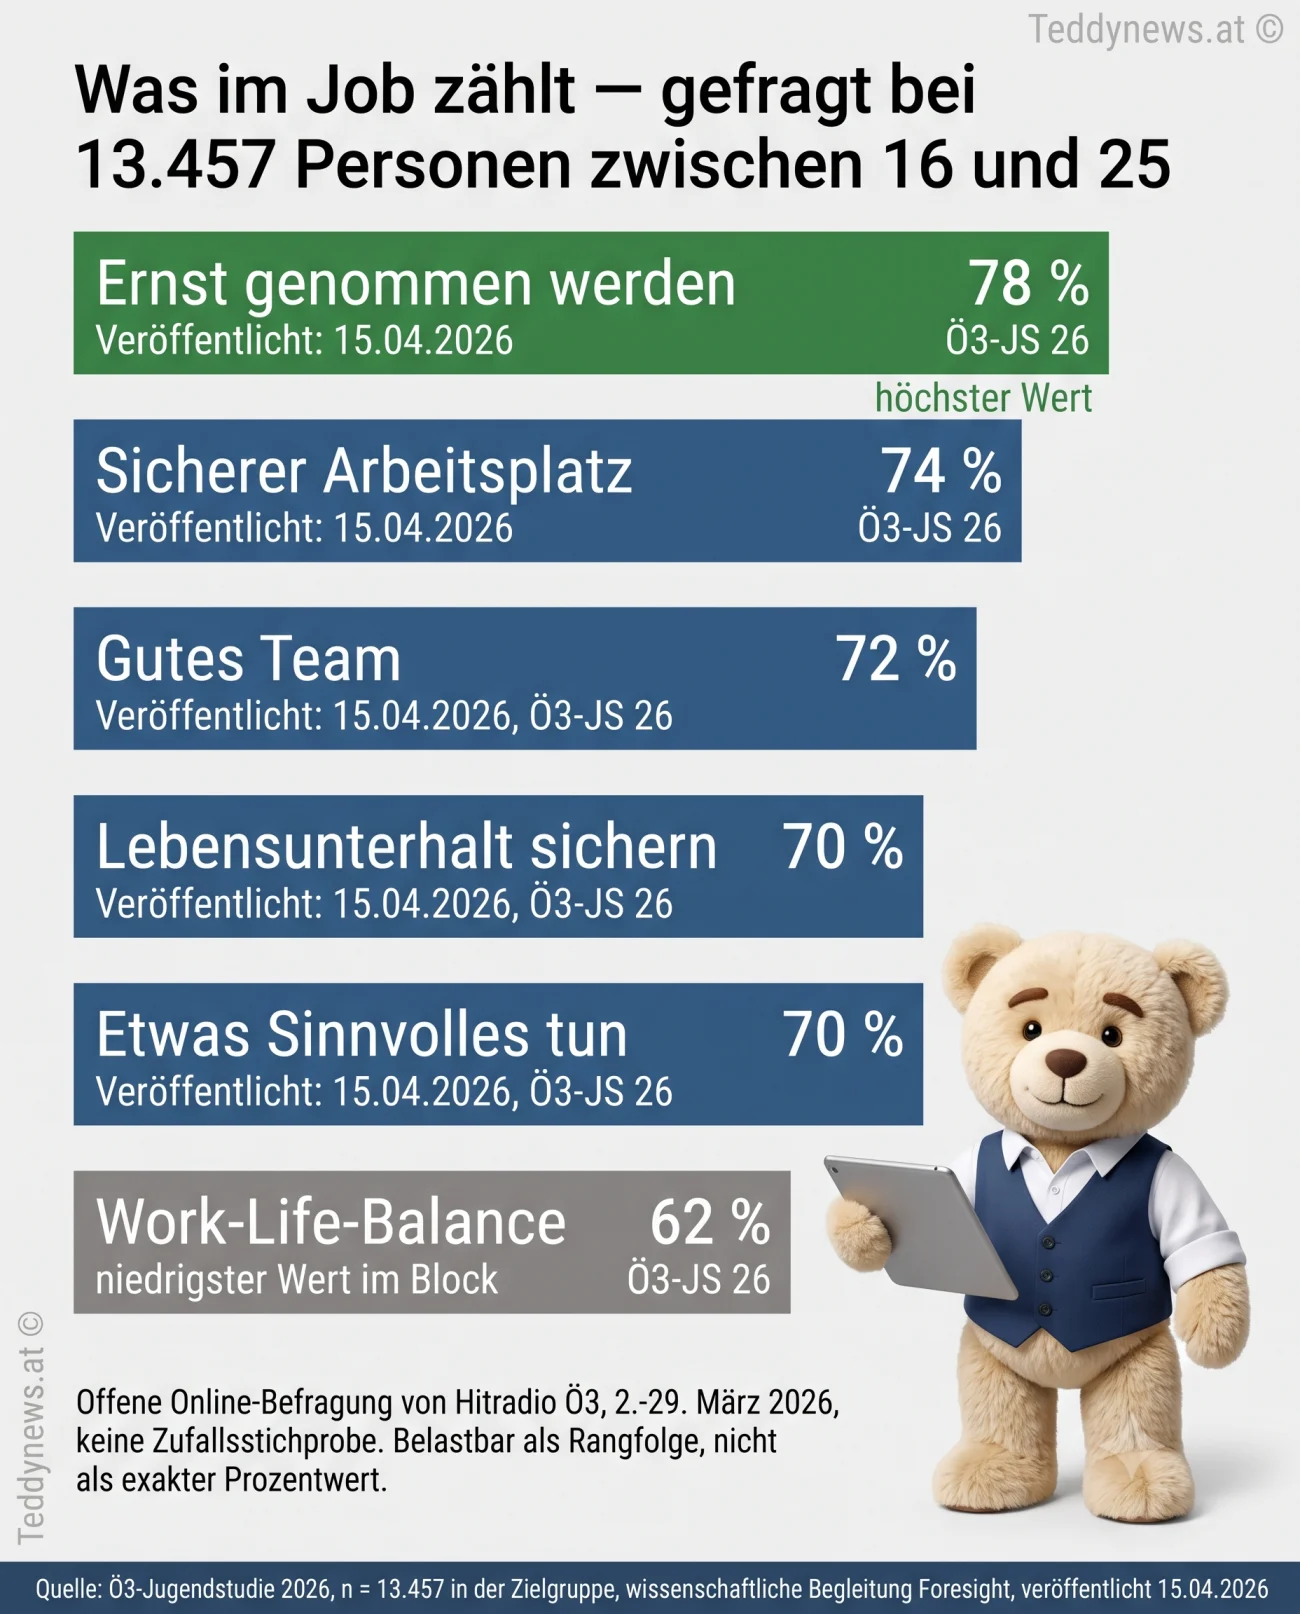
What counts at work — same survey
Ö3 Youth Study 2026, n = 13,457 in the 16–25 target group Measured, with the same sampling note.
What this ranking refutes: security (74 %) ranks clearly above work-life balance (62 %) — the lowest of the six values. The common cliché about this age group does not hold for Austria. And the highest value is not a demand on the employer but one on the tone: being taken seriously.
Who has done it
This section is empty — on purpose
Three to five people should stand here who actually took the route via region or occupation: with a date, a place, a trade and a verifiable trail. We have no such cases that meet that condition. So nothing stands here.
What would be missing if we made it up
Invented or anonymised success stories are the fastest way to make the rest of this page untrustworthy. “Lisa, 19, made it” cannot be verified — and a page whose only promise is verifiability cannot afford exactly that.
What we need instead: real people who consent, with first name, age, province, trade, year and a trail that can be checked — the company, the chamber, the training contract. Until that exists, this section stays empty and says why.
Open item, dated: 25 July 2026 · contact: Wolfgang Lindner · condition for publication: written consent plus a checkable reference.
Disclosure
Who pays for this page and what they sell
This page is run by Teddynews, an Austrian family business that has manufactured mascots since 1998 and today also sells AI courses from 79 euros, AI landing pages and AI social media automation. The personal contact and intermediary is Wolfgang Lindner.
In plain terms: we make money when you use AI. This page therefore has a commercial interest in one particular conclusion — and you should know that before you form a view on the rest.
That is why the source sits under every figure. Not in a footnote, not in an imprint: right next to it, with source, reporting date and, for any change, the base year. None of the six addresses in “What is open” belongs to us and none of them earns us money. If a figure on this page is wrong, that is demonstrable — and we then correct it and note it under “Data status” below.
And one finding that works against us: in the same Ö3 Youth Study that produced the 96 per cent, the target group states explicitly that digital skills matter but that digitalisation must not become an end in itself. That is a direct warning to an operator selling AI products. It is here because otherwise somebody else would find it.
No third-party tracking, no profiling, no account required for any content on this page. No streaks, no autoplay, no push notifications, no read receipts. Contact: office@teddynews.at · +43 676 3335888 · Imprint
Method
Where every figure comes from — and where this page is uncertain
Four terms you need in order to find the sources
Matching problem
Training places and applicants exist in sufficient numbers but do not meet: the places are in other regions, other occupations, or carry different requirements. BIBB names three types — regional, occupational and qualification-related. A shortage would be something else: then there would be too few places.
Apprenticeship gap
The difference between people seeking an apprenticeship and vacant apprenticeships in Austria, as an annual average. Positive means more seekers than places. In 2025 it was around 2,190 people; in 2024 the market was nearly balanced. The AMS forecast for 2026 gives 3,720.
Apprenticeship pressure
The number of people seeking an apprenticeship per vacant place. Below 1.0 means more places than seekers, above 1.0 more seekers than places. Across Austria it was 0.70 in 2023; in Vienna 3.50 — the only province above 1.0.
Supply-demand ratio
The German term used by BIBB for the same relationship, counted the other way round: training places on offer per 100 people demanding one. Below 100 means fewer places than demand. Broken down by region it sits in BIBB table 37, by employment agency district.
Why this page offers no reassurance
Correlation with actual action. Source: “Hopium or empowering hope? A meta-analysis of hope and climate engagement”, PMC10465179 Transferred
The limitation belongs with it: these values come from climate communication research, not from labour market research. The transfer is plausible — both are large threats with low perceived personal control — but it is a transfer and not a measurement on this target group. Hope interventions in general work at d = 0.08; the personal self-efficacy subtype at d = 0.18 (k = 2), the “in-depth” subtype at d = 0.49 (k = 2).
A second, independent finding points the same way, this time from Austria and from the target group itself: 78 per cent want to be taken seriously — more than any other work value. That is why this page carries no “it is not that bad”.
Four rules this page is built on
- Figure before judgement. The first sentence of the page is a figure with a reporting date, not a greeting and not a claim.
- Every change names its base year. Without a base year a percentage cannot be verified — and that is exactly where change figures without a base year fail, see “Data status”.
- Gaps are named, not filled. No separate pressure value exists for the western and eastern regions. So none is given there.
- Aggregate and segment kept apart. Every unemployment rate states that apprenticeship seekers and people in training schemes are not included.
Updates and ageing
- AMS data: monthly. The September 2025 values are a reporting date, not a permanent state.
- BIBB data: annually, each December. The 30 September 2025 reporting date will be replaced in December 2026.
- Ö3 Youth Study: annually, most recently 15 April 2026.
- This page is dated 25 July 2026. If you are reading it much later, check the three sources directly — the links are in the source list.
Admitted uncertainty is deliberate here: a figure with a reporting date that will be re-surveyed in December can be checked. A figure without a reporting date cannot.
How this page can be measured
- Share of visitors who operate the gap map — that is, select a region other than the default
- Share who click one of the six external addresses
- Return rate after more than seven days
- Not measured: “anxiety reduced”. That is not measurable, and anyone claiming it cannot evidence it
Open item, openly stated: these three measures are defined but not yet implemented. They require a server-side, cookieless counter without profiling. Until that exists we do not know the values — and we do not assert them.
Data status, verification history and open items
As of 25 July 2026. All values reflect the state of the primary sources verified on that day. AMS data is re-surveyed monthly, BIBB data annually each December, the Ö3 Youth Study annually.
Why every percentage carries a base year. The change in youth unemployment can be presented as +25.5 or as −31.4 per cent depending on the base year — with an identical end value. That is why the base year sits on every change figure in the HTML and in the text, and why the selector above is operable rather than asserted.
Why the Vorarlberg value counts as uncertain. It differs from the national September figure in month and region simultaneously, factor 5.6, not separable into season and region. The load-bearing matching evidence is the German one: 54,400 against 84,400 from the same survey on the same reporting date.
Open items, openly stated. The study “Jugend in Deutschland 2026” contains a chapter on AI in the labour market — existence and topic verified, figures not, because the study is paid for; it is therefore not used. Also not used: the claim that the skilled-trades market has been overrun by an influx — no reliable evidence was found. The three success measures above are defined but not yet implemented. The section “Who has done it” is empty because no verifiable cases exist.
Help
When it is more than worry
This is a data page, not a counselling service. If the situation weighs on you more heavily than described here, these are the places for that. All four are free of charge and all four were checked against their official pages on 25 July 2026.
Additionally for Austria: bittelebe.at — suicide prevention, also pointing to 142 and 147. All numbers and addresses checked against the respective official page on 25 July 2026. This page makes no diagnoses and gives no therapeutic recommendations.
Frequent questions
Eight questions, answered briefly
What is a matching problem?
Training places and applicants exist in sufficient numbers but do not meet. The German Federal Institute for Vocational Education and Training names three types: regional, occupational and qualification-related. The evidence for 30 September 2025 in Germany: 54,400 vacant apprenticeship places alongside 84,400 applicants left without one.
How many apprenticeship places are open?
In Germany 54,400 places stayed vacant on 30 September 2025, which is 10.6 per cent of all places offered (2024: 69,400 and 12.8 per cent). In Austria 7,678 apprenticeships were immediately available in September 2025, against 10,823 seekers without an offer in hand.
Has youth unemployment in Austria risen sharply?
By 25.5 per cent since 2022 — but 2022 was the lowest value in the twelve-year series. Against 2018 the 2024 figure is 1.3 per cent lower, against 2015 31.4 per cent lower, and 2024 is the fifth lowest of twelve years. The increase is real, the level is not historically exceptional. What holds up is the concentration: under-25s up 11.2 per cent from June 2024 to June 2025, Vienna at an 11.7 per cent rate, technical occupations most affected.
Where in Austria are the most vacant apprenticeships?
Around 52 per cent of vacant apprenticeships are in the western region, around 61 per cent of seekers in the east. In 2023 Vienna had the highest pressure at 3.50 seekers per vacant place and was the only province above 1.0. In Vorarlberg, 1,133 vacant places faced 283 seekers at the end of February 2026 — though that value is not directly comparable with the national September figure.
Does the unemployment rate include everyone affected?
No. The AMS youth unemployment rate does not count people looking for an apprenticeship or people in training schemes. For 2025 that was 9,166 apprenticeship seekers and 29,854 people in training schemes, against 34,034 registered unemployed. Quoting only the rate understates how many are affected.
What does this age group want from school?
96 per cent want more everyday knowledge, explicitly financial knowledge — the highest single value in the Ö3 Youth Study 2026. Then 88 per cent more general education, 87 per cent more room for discussion, 85 per cent more interactive learning. Important: this is an open online self-selection survey, reliable as a ranking rather than an exact percentage.
What counts most at work?
Being taken seriously at 78 per cent, ahead of a secure job at 74, a good team at 72 and doing something meaningful at 70 per cent. Work-life balance is the lowest of the six values at 62 per cent. The common cliché about this age group therefore does not hold for Austria.
Who runs this page and earns from it?
Teddynews, an Austrian family business founded in 1998. Personal contact and intermediary: Wolfgang Lindner. The company sells AI courses from 79 euros, AI landing pages and social media automation — so it earns money when you use AI. None of the six addresses listed under “What is open” belongs to it or earns it anything. That is why the source sits under every figure.
Sources
All sources with date and link
All links checked for status on 25 July 2026. Licence for this page: CC BY 4.0 — reuse permitted with the attribution “Teddynews, The Gap”; the primary sources keep their own licences. Related data page by the same operator: CO₂ and AI — the figures for 2025/2026 (German).
CO₂ and AI — the numbers for 2025/2026
Same method, different topic: who causes the CO₂, and how much of it is AI? 38.4 Gt of energy-related CO₂, data centres at 1.5 per cent of world electricity. 67 sources, every figure with its certainty status.